
Cash is King, or at least it should be, for all businesses – no matter the size. Still, many companies focus on profit, rather than on working capital (cash). Profit is important, but positive cash flow is what keeps the company going. By now, we should have all learned that lesson. A lack of working capital was the primary “cause of death” for many U.S. dot-coms in the early 2000s. The same issue was also the reason for many of the bankruptcies filed during the recent financial crisis.
Therefore, the primary focus of any business should be positive cash flow management.
What is Cash Flow? Simply put, cash flow is the movement of money in and out of a business. The goal of cash flow management is to decrease the amount of time it takes to collect cash, while increasing the time interval for disbursing it. The first step in improving cash flow is to determine why there’s a cash flow problem. Where is cash tied up?
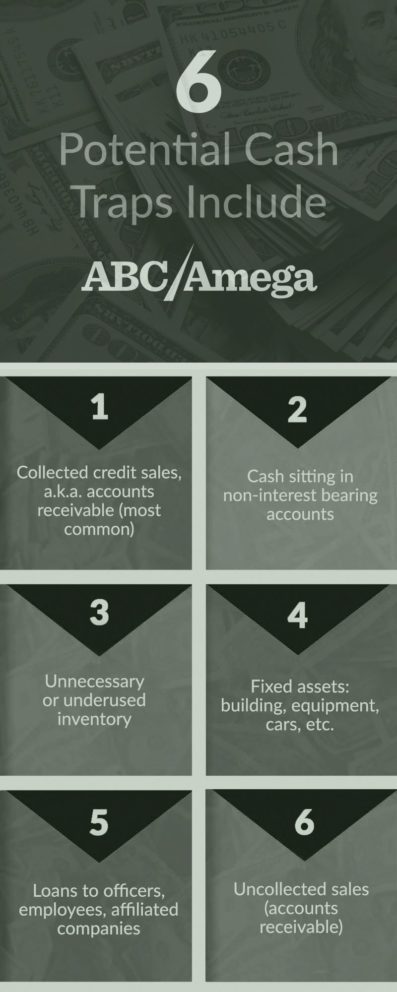
Some potential cash traps include:
- Cash sitting in non-interest bearing accounts
- Unnecessary or underused inventory
- Fixed assets: building, equipment, cars, etc.
- Loans to officers, employees, affiliated companies
- Uncollected sales (accounts receivable)
One of the most common cash traps is uncollected credit sales, a.k.a. accounts receivable. The focus of this article is on how uncollected sales can negatively impact your cash flow and how the Days Sales Outstanding (DSO) calculation can give you an inside view of the cash trapped in your accounts receivable.
The Accounts Receivable Cash Trap
Selling on credit is a requirement in today’s economy. Most companies can’t compete domestically or globally unless they can offer credit terms. Unfortunately, too many credit buyers treat credit terms as if they were interest-free, perpetual loans. Their tactic is to drag out payment as long as possible. As a result, many sellers end up with an inordinate investment in accounts receivable tying up their cash flow.
Calculating just how much it costs to carry your receivables is relatively simple. Determine how much interest you would pay per day on your total annual receivables and multiply this by the average number of days it takes you to collect on credit sales (DSO).
You only need three numbers: your total annual receivables, your DSO and interest rate.
The interest rate could be the actual interest you pay for your line of credit, the prime rate, the marginal cost of capital, etc.
Example 1: XYZ Company has $20,000,000 in annual credit sales and a DSO of 65 days. We’ll use an interest rate of 3.25% and round the results to the nearest dollar.
| Cost of Carrying Receivables ((Total Receivables x Interest Rate) / 365 (days)) x DSO |
(($20,000,000 x 3.25% or 0.0325) / 365) x 65 = $115,753 |
Thus, it costs XYZ Company $115,753 in interest every 65 days (or $649,998 annually) to provide its customers $20,000,000 in annual credit facilities.
All well and good. But is this a reasonable investment? Here’s one way to determine that. First, benchmark your DSO against the average DSO in your industry. Then, complete the worksheet below to determine your excess investment in receivables.
Example 2: We’re assuming the average DSO in XYZ Company’s industry is 50 days.
| Excess Receivable Investment | |
| XYZ’s DSO | 65 days |
| Industry DSO | 50 days |
| Excess Investment in Receivables | 15 days |
| 1 Day’s Sales (Annual Sales/365) |
$54,795 |
| Cash Invested in Excess Receivables | $821,925 |
| Cost of Borrowing | 3.25% |
| Annual Interest | $26,713 |
| Cash Flow Trapped in Receivables | $848,638 |
In this example, XYZ Company has $821,925 cash invested in excess receivables, plus $26,713 in interest charges, for a total $848,638 cash flow trapped in receivables!
Improving Cash Flow by Reducing DSO
If XYZ Company can reduce its DSO by just 5 days, it can free up almost $283,000 in cash flow. Let’s see how.
Example 3: XYZ Company’s DSO Comparison
| Excess Receivables Investment with DSO = 65 days |
Excess Receivables Investment with DSO = 60 days |
Improvement | ||
| XYZ’s DSO | 65 days | XYZ’s DSO | 60 Days | 5 Days |
| Industry DSO | -50 days | Industry DSO | -50 days | |
| Excess DSO | 15 days | Excess DSO | 10 days | |
| 1 Day’s Sales | $54,795 | 1 Day’s Sales | $54,795 | |
| Cash Invested | $821,925 | Cash Invested | $547,950 | $273,975 |
| Cost of Borrowing | 3.25% | Cost of Borrowing | 3.25% | |
| Annual Interest | $26,713 | Annual Interest | $17,808 | $8,905 |
If you add the $547,950 improvement in Cash Invested in Receivables with the $17,808 reduced interest costs, you get $565,758 cash flow trapped in receivables. Now, compare this to the XYZ Company’s original cash flow trapped in receivables, which was $848,638.
$848,638 – $565,759 = $282,879
XYZ Company was able to reduce their cash flow trapped in receivables by $282,879.
Reducing DSO
As you can see, DSO has a tremendous impact on cash flow. Reducing DSO, even slightly, can go a long way toward improving the health of your company.
The next step, of course, is to find ways to reduce DSO. Answer these questions in each area of your A/R management process to find holes that need to be plugged.
Credit Approval
Are you performing credit evaluations on all new customers? Are your credit terms appropriate and adhered to by your sales department? Are you approving and/or denying credit applications in a timely manner? Do you have a procedure in place for updating credit information on a regular basis? Do you belong to an industry credit group?
Invoicing
Are your invoices accurate and prompt? Are payment terms clearly stated? Do you provide incentives for early pays? Have you developed exception reports for when actual performance deviates from expectations? Have you considered EIPP (electronic invoice presentment and payment) or other automation services for billing?
Receivables Management
Do you have a collection process in place? Do you adequately follow-up on customer disputes and late pays? Are you measuring performance against goals? Do you regularly review aging reports? Do you have an understanding as to why customers are paying late (i.e. invoice discrepancies, quality issues, etc.)? Have you trained your customers to pay within terms?
Collections
Do you have employees focused on collections? Are they well trained? Do they have enough time to follow up on all past due accounts? Have you considered outsourcing part of your receivables portfolio (small balances, specific divisions, etc.) for 1st party collections follow-up? Have you ensured discounts offered will benefit your company? Are you applying payments to an account the same day funds are received, and allocating each payment to a specific invoice? Should you consider using a professional 3rd party collection firm?
Just a small improvement in DSO can go a long way toward improving the health of your company – and a healthy company is in a position to meet the needs of all its stakeholders and customers, making everybody happy.
Further Sources of Credit and Collection Benchmark Information
Industry Credit Groups
If you belong to an industry credit group, you should have access to this information through your membership. If you don’t belong to a credit group, consider joining one. Participation in the confidential exchange of credit data provides members with access to valuable information for evaluating credit risks and thereby minimizes collection problems and helps improve DSO. If you are not sure about the value of credit group membership, read the Credit Today article Credit Group Participation ROI Averages More Than 100 Percent Per Week.
The Credit Research Foundation (CRF) conducts surveys by industry which detail relevant statistical information concerning domestic accounts receivable performance. The survey is titled National Summary of Domestic Trade Receivables. Information by industry is available to CRF members and companies participating in the survey.
Your Industry Association should be able to provide these statistics, or at least tell you where you can find them. If it doesn’t, suggest they start performing annual surveys to develop these, and other important benchmarks for your industry.
If you enjoyed this article, check out these other credit management articles.
For more information about our credit management services, contact us at 844.937.3268 today!